Iain Gordon of Evolution Measurement gives an outline of how the Ensign N180B student team from the National Centre for Motorsport Engineering at University of Bolton captured some crucial ground effect data, and what teams do with such information.
16 EvoScann® P16-A (16 channel scanners) were fitted to the upper aero surfaces and the underside of the car with Scanivalve pressure patches/pressure tappings, set to run at 100Hz – 100 readings per channel, per second, so around 26,000 readings per second and 1.5M readings per minute, and transmitted their live data to a Motec data acquisition unit mounted on the car.
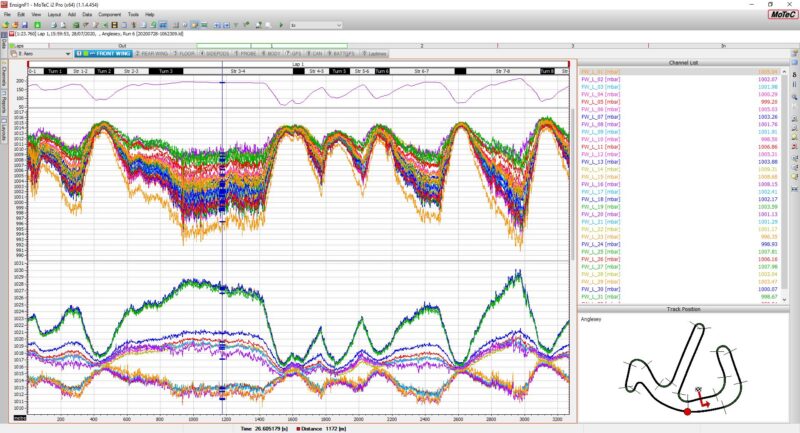
As the car accelerated away from the start in a clockwise direction, it started to collect data on every part of the circuit and the data that was relayed to our screen represented the first 8-9 turns on the 10-turn circuit. The full lap was 2.5 km, and the lap record was around 61 seconds.
Data on the upper half of our screen represented the underfloor pressure tappings, the data on the lower half gave us the bodywork surface pressures. The fastest parts of the circuit were before braking at Turn 4 and Turn 8. That’s where the underfloor pressure was lowest. It was creating a dynamic pressure of 993-994 mbar – i.e. significantly below atmospheric static pressure – the car was generating negative lift (‘suction’), from its underbody, as you would expect from a race car, and this was pulling the car down to the track and enabling it to gain traction and stick to the road, especially through corners. Similarly, the pressures on the body work were higher than atmospheric and that was pushing the car down at high speed. You could see that before Turns 3-4, the overbody pressure was highest and the underfloor pressure was lowest, slightly more so before braking for Turn 8.
You could also see that the pressure readings all got close together when the car was travelling more slowly – because there is less of a velocity impact across the sensors that were spaced out across along the length of the car.
There was a lot more data available as an overlay from the other tabs, which listed the pressures at the probe, the rear wing, further back on the floor (often the difference between 49 front of floor and rear of floor is four times the pressure on a modern F1 car with a flat floor and lots of body rake, this is a ground effect car which sits flat and effectively makes the whole length of the floor a long venturi tunnel to accelerate the air between the floor and the track).
When it comes to interpreting all the data from such tests, usually the Race Engineer will also map strain gauges, GPS, brake pressure, throttle position and use the Motec system to overlay each of these tabs on to the aero data.
He can then see where the car is fast, or where it’s slow and can be improved. In F1 they will also overlay the data from two cars over each other and find where one car/driver is fastest.
By picking all the fastest sector or corner times and speeds from both cars they can easily find the fastest possible lap with that car and use that as a benchmark. They will then make changes to wing settings or ride heights and take a set of readings for overlaying and see how that has changed the car data and ask the driver about the feel of the car and use this to enhance the car performance.
So, how to use the data? The aero guys will have calculated using CFD how the pressures will be on the real car and worked out optimum fine adjustments to get that set-up. Then by measuring data on a model in the wind tunnel they will match or correlate the data from CFD model to wind tunnel model and optimise body shapes, wing shapes, etc.
Then they take all these settings and apply them to the real car. By making changes to the CFD model and/or the wind tunnel model they will work out whether the full size car will be quicker or lower – always trading downforce that gives corner speed against drag which reduces straight line speed, and they will find the best compromise of performance that gives the best lap time. The next stage is to start changing wing shapes or body parts and seeing how they will compare on lap time and they will design those parts on CFD, then print them as 3D model parts and try them in the wind tunnel before going to the expense/risk/ time of manufacturing them in carbon fibre and fitting them to the car.